Sampling Error — And Other Reasons Polls Differ
Summary: The wide discrepancies across polling data raises the question about the sources of survey error. This article will discuss the different types of survey errors within the context of political polls. Even for those conducting feedback surveys for their organizations, lessons can be learned.
~ ~ ~
During this political season friends and colleagues have asked me about the numerous polls, why they are so different, and what’s the nature of the error in “margin of error”? While I’m not a political pollster, the issues pollsters face are the same that we face in the feedback surveys for our organizations. We have many opportunities to make errors in our survey execution, and I’ll give a brief explanation of them here.
Let’s start out with margin of error, sometimes abbreviated as MOE. You will also hear the term statistical accuracy and sampling error used to describe the survey’s margin of error. This “error” isn’t an error in the normal sense of the word. Our error here is that we didn’t get data from enough people. While we may think of that error as a mistake of survey design or survey execution, many times because of the size of our population — our group of interest — we cannot get more data. The size of our respondent group “is what it is.” With political polling, the population is huge, but the size of the respondent group is more a factor of the cost of conducting the survey. It’s a trade-off. More responses mean higher accuracy but also higher cost.
We typically only hear reported the MOE, which will be around +/- (plus or minus) 3% or 5%. However, every MOE has a second component, which is our confidence level. That is, we have a certain confidence level that our results are within some margin of error. By convention, the confidence level is 95%. If some researcher used a different confidence level and didn’t report it, that would be questionable research ethics. Why? Because the confidence level and MOE move in opposite directions.
I like to describe this interplay of confidence level and MOE using a dart throwing example.
If I stand five feet from a dartboard, I have some level of confidence that I could throw a dart within an inch of the bull’s eye. Think of that inch as the MOE. If I back up to ten feet from the dartboard, I would have a lower level of confidence of hitting that one-inch area. (Lower confidence for the same MOE.) However, I would have the same level of confidence at the ten foot distance as I did at the five foot mark but of hitting a larger area around the bull’s eye. (Same confidence but a larger MOE.)
But what does a statistical accuracy of 95% +/- 3% mean? Technically, if we repeated the same survey 20 times, each with a different sample drawn from the population, we would expect the scores from 19 of the 20 — or 95% — to fall within plus or minus 3% of the score we first got. So, if a poll has two candidates within 2% and the MOE is +/- 3%, you’ll hear said it’s a “statistical dead heat.”
So how come multiple polls with similar accuracies have results that lie beyond the MOEs, for example one poll showing candidate X at 42% and another poll showing candidate X at 49%, each with a MOE of +/- 3%? The differences probably lie in other errors or biases that are confronted in surveying. These errors fall into three broad areas:
- Errors from Survey Instrumentation Bias
- Errors from Survey Administration Bias
- Errors from the Determination of the Research Objectives
- Errors in the Survey Data Analysis
Instrumentation bias results from the design of the survey instrument or survey questionnaire. The most common form of this bias comes from the wording of the questions. Questions might have ambiguous wording, double-barreled questions, lack a common benchmark, lead with an example, have loaded wording, or poorly designed scales. All of those could lead the data captured to not accurately reflect respondents’ true views.
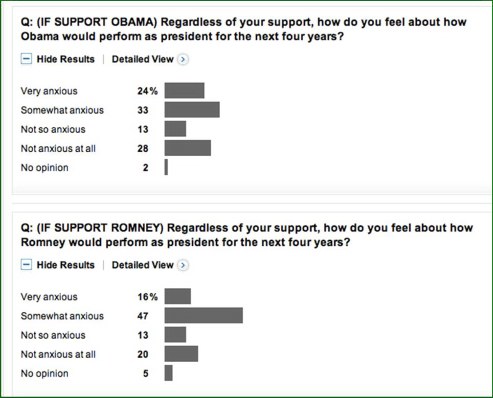 For example, let’s look at a Washington Post ABC news poll from late August, 2012. One survey question used an “anxious scale” that could easily create ambiguity. I have never seen an “anxious scale” used — and for good reason. “Anxious” can have multiple meanings. In high school, I was anxious for the school year to end but I was also anxious about final exams.
I could be anxious for Mitt Romney to become president, but I could instead be anxious about Mitt Romney becoming president. Ditto for Barack Obama. “Anxious” here could be interpreted as, “I can wait!” or “I have anxiety about it.” Those are very different interpretations of the word “anxious.”
Remember, this was a telephone survey so nuanced meaning in the wording can’t be discerned by rereading. Additionally, note the syntax in the question: “…how do feel about how…” This horribly contorted construction increases the likelihood of someone misunderstanding the question.
Comparisons between surveys can also be dubious because different surveyors use different scale lengths, i.e., the number of points or options in the response set. How can you then compare the results across surveys? You really can’t. If the question is a binary choice — are you voting for Obama or Romney? — the cross-survey comparisons are more legitimate, but what if one survey includes the Libertarian and Green candidates? That muddies the comparisons.
Question sequencing also matters. If a survey asks a bunch of questions about a candidate (or a product), and then asks an overall assessment question, that assessment is colored by the preceding questions. Sometimes these lead-in questions are just straw-men, leading questions with loaded wording that are meant to prompt negative or positive thinking.
All of these sources of instrumentation error can and will happen even in a professionally designed, politically neutral survey, but they can also be used by surveyors to doctor the results to get the findings they want.
Administration bias results from how the survey is actually conducted. Here, we are not necessarily dealing with errors of execution. Survey administration decisions confront a series of trade-offs where there is no one right approach. All survey administration methods have inherent biases that we attempt to control.
Telephone surveys tend to get higher scores than other forms of surveying, especially when posing questions asking level of agreement with a series of statements. But telephone surveys also tend to get people to respond who don’t have strong feelings, which reduces non-response bias.
Non-response bias is caused by people not participating and thus we don’t have data from them. If the non-participants differ structurally from the participants, then the data collected aren’t representative of the overall group of interest. How to measure non-response is a quandary for surveyors since it’s caused by people who don’t want their views measured. That’s quite a Catch-22!
If we look at the political polls in detail, which are typically done by telephone, we see respondent groups that include people who are not registered to vote and people who indicate they aren’t likely to vote. (The New York Times‘ polls typically include 10-15% unregistered voters in their respondent group.) If a survey used other survey methods, such as web form surveys, these people would be far less likely to take the survey, increasing the non-response bias. At issue is whether the purpose of the poll is to understand the views of the general populace or to predict the election. If we’re unclear about this, then we have introduced an error from having a poorly defined set of reserch objectives. This error I find to be very common in organizational feedback surveys.
The only certainty on which all surveyors would agree is that the lower the response rate (or compliance rate for telephone surveys), the greater the likelihood of non-response bias.
Telephone surveys do run the risk of introducing interviewer bias. If every interviewer doesn’t deliver the survey script identically, then we run the risk of the data not reflecting the actual views of the respondent group. One of the polling companies, Rasmussen, uses interactive voice response (IVR) surveys, which are recorded scripts to which respondents enter their feelings via the phone keypad.
While interviewer bias is eliminated, IVR surveys can introduce a sample bias. The person who takes the IVR survey is probably the person who answers the phone. Is that really the person whose views we want? It could be a 13-year-old. Surveying with live interviewers allows for better screening of the respondents to get a more proper sample. In fact, they may not talk with the person who answers the phone, but instead ask to speak to the adult in the household who has the next birthday. This practice helps insure a random selection of people to take the survey.
Most polls present the results for “likely voters” as well as for all respondents. How “likelihood to vote” was determined (or “operationalized”) by each poll can make a large difference. Did the survey simply ask, “How likely are you to vote in this year’s election?” or did they ask for whom the respondent voted in the last one or two elections and classify the respondent based upon whether they answered “did not get the chance to vote”? (The “did not vote” option is always phrased in a neutral, non-judgmental manner.)
If you look at the poll results from, say, the NY Times polls, you will see a self-reported, very high likelihood to vote, typically over 80%. However, the actually percentage of registered voters who will vote will be somewhere around 60% to 65%.
This dichotomy in how the data are analyzed highlights another type of error in play that is caused in part by the survey administration and in part by the survey instrument: response bias. Response bias is the bias or predisposition that the respondent brings to the process that the survey may activate. We are taught that voting is a civic duty, so people are likely to say they intend to vote when they don’t. That’s why the pollsters who simply ask, “How likely are you to vote” go to the next level of trying to assess the enthusiasm of the respondent since that’s a better indicator of actual voting likelihood. But is asking about past voting activity a better indicator of voting likelihood? There’s disagreement on this.
Both response bias and non-response bias will be present to some degree in every survey. We can only attempt to minimize those biases.
But the survey data analysis can also introduce error into how readers perceive the results. What if the demographics (such as income, age, race, and gender) of our respondent group do not match the known demographics? Here, the pollsters will perform statistical adjustments, which are a complex form of weighted averages, to make the respondent group reflect the actual group.
That practice has been controversial in this 2012 election. The demographic profile of voters from the 2008 presidential election was markedly different from past elections, as was the 2010 mid-term elections. If pollsters adjust the polling results to reflect the 2008 demographic profile of voters and the 2012 actual voting profile returns to historical norms, then the adjustments will be introducing another source of survey error from incorrect data analysis.
An additional controversy about statistical adjustments we are hearing this year is whether adjustments should be made based upon self-reported, political party affiliation. Democrats have been over represented in much of the 2012 polling data when compared to party registrations. The pollsters say they adjust for attributes of respondents (that is, demographic variables) and not for attitudes. They argue that party affiliation — an attitude — is too fluid to use as a basis for statistical adjustments. We shall see on November 6.
~ ~ ~
Phew! Note how many different factors can skew a poll’s (or survey’s) results. So, the next time you scratch your head at why the polls say different things you’ll know there’s a lot in play. For this reason, Real Clear Politics takes an average of all the polls, arguing that this index is more accurate since it balances out on net the skews that may be built into any one polling approach.
Frankly, I’d rather we had no political polls. Journalists would then be forced to do their jobs to enlighten us on the issues rather than have talking heads discussing the horse race. IMHO…