University Help Desk Survey Creation

I had the opportunity to talk with Joyce Sandusky of Clayton State University, just south of Atlanta, about the survey program she helped design for Clayton’s technical support center. From previous conversations with her, I knew she had invested a lot of time, energy, and thought into the program. So, I thought her experiences and lessons could benefit others, whether you’re going to create a survey for a university IT help desk or whether you’re going to conduct a corporate help desk survey.

Joyce, thanks for taking the time to chat. First, briefly describe the Clayton help desk survey program.

“The HUB” is the name for our help desk. It supports all computers on campus – laptops, desktops, telephones,  etc. Last December [2006], we surveyed staff, faculty, and students to learn their feeling about our quality of service.

What was the impetus for creating the program?

After going to your seminar at a Help Desk Institute conference, I was motivated to do a better survey for our support center staff. We have been in operation for 10 years, and five years ago we did a very crude, 10-question survey, sending out a survey invitation to every 5th ticket at closure. We didn’t realize it at the time, but it was a very biased survey since it didn’t give respondents a chance to say they were unhappy. So, we went around telling everybody that we had a 97% approval rating. Later we realized that the survey was biased. We knew we needed to do a better survey if we were going to learn how well our help desk was performing.

So how did you proceed to create a survey program?

When I was out on a medical leave for a month last summer [2006], I bought and read through your customer survey book. When we were creating our own customer loyalty program, we used the book as our instruction manual. It was very easy to understand and follow. And I felt like we did a lot better with it as a guide than if we did it on our own. You’d think I was a stalker the number of times I read your book.

We knew this first survey would be rough, and I tried to follow the book as much as we could to be sure we were doing it right.  We decided to do an annual survey. It has turned out better than I thought it would.

We started in July 2006 and created a customer loyalty team, composed of faculty, staff and students – though the student representative fizzled out.  Our intention was to build a foundation for an ongoing program. We held an initial meeting with all of the technical support specialists to introduce the customer loyalty program.We then held a meeting of the full customer loyalty team, which included representation from each of our customer bases, (i.e., faculty, staff, and student.)

Within that team we had a survey questionnaire design team focus on creating the survey instrument. From your book I knew it would take a lot of time, and we proved it! This team conducted focus groups of the different groups we serve. After the focus groups, the team met to analyze the focus group data.  They identified the attributes of our help desk service that left an impression.

In the staff focus group we asked the participants to tell us about an experience they had had with the HUB. We learned that the staff didn’t know how to contact us and that their idea of an emergency was different than our idea of an emergency. We realized that we needed to ask how well they perceived that we responded to their issues. That focus group discussion revealed that we needed a survey question about how easy it is to work with our procedures.
The focus group ultimately told us that we needed to survey three areas.  One was policies and procedures.  Another was speed of problem resolution. The third was courtesy of staff. We had one question on the survey for each of those areas.

Since we had three different groups of customers, we tailored the survey to each group, asking different questions of faculty, staff, and students.

So, you set up some branching logic once you identified the type of respondent?

Yes, however, the soft skill questions on the survey were the same for all three groups.  For example, “Did we show concern for your time?”

Once you completed the survey questionnaire, how did you administer the survey?

Your book said you need a budget. We had no budget because we’re a university. However, we were able to use university resources including a programmer and I was allowed to dedicate the majority of my time to the project. Unfortunately, doing it all in-house also led to our biggest problem. The first programmer had never done any type of survey, and he consumed most of our allotted time. Two weeks before we wanted to send out the survey, the programmer told us he couldn’t do it. We scrambled for a new in-house programmer, and we got a guy who was really sharp.  He did a great, quick job for us. However, we ran into a problem with the branching questions and feel like we may have lost a lot of data from the technical questions on the survey.

We sent out 7200 email invitations and got back 292 responses. That included 74 open-ended comments on the 292 responses. Mostly these were positive comments.

But the timing [for sending out the invitations] was poor. We wanted to send it out over Thanksgiving week, but because of the programming problems, it didn’t go out until December 12. Classes had ended December 10. We know we needed to send it earlier than we did.

Also, our student body is about half non-traditional. 55% of respondents were 30 and above. It was mostly the non-traditional students who responded since they seemed to be ones who checked their email after the semester ended. We have a lot of services available to non-traditional students, which may explain why we got such positive results.

That’s an interesting example of an administration bias, resulting from the timing of the survey invitations and the broad nature of the respondent group.

We also got a low faculty response.

That’s probably because they were busy grading final exams. Did you provide any incentive?

We had a minor incentive.  We gave the first 100 responses a free sandwich at Chick-fil-A, which they [Chick-fil-A] donated. Out of the 100 only about 40 took the sandwich.

That may have introduced an administration bias as well.  If you don’t like their chicken, it’s not much of an incentive.

What did the survey results show?

The results did show that the big problem area was communication. For example did we explain how much time it would take to resolve the problem? We got high scores in most all soft skills, but not on communication.

We asked how many people contacted our website. It was about 80%. Over half the faculty had visited the self-help guides, but only 10% of students did. What we gleaned from this was that we needed to keep the self-help guides up to date for faculty, but we may not invest resources into self-help for student-related issues.

I went to a course in Minitab last fall, but I had to relearn it this spring when doing the data analysis. They have the best customer support; it’s incredible. In one case she actually did the analysis and sent it back to me. If I couldn’t figure out how to do it in Minitab, I did it in Excel. In hindsight, I might have just used Excel.

I wish I were more familiar with statistics, and I hope that every year we will increase in that.  We had a business professor work with us on analyzing the results.  He has written an article about the survey results that he hopes to get published in an educational journal.

Several times you’ve mentioned the effort to create the survey program. How much time did you personally spend on the survey design effort?

As I said, I started in June 2006 when I was on medical leave. I spent all June & July on this. I then spent 2 weeks every month full time for August to February. Then in March to mid May I spent 3 weeks each month doing the analysis and writing the report.

That is a lot of time! What’s next for the customer loyalty program?

We spent the first few months of this year [2007] analyzing the results. The team met in May to go over the results and are planning for our next survey for the fall of 2007. We started planning in July for a Thanksgiving rollout. This year it won’t take as long.

This fall one of the things we’re doing differently is that the university is looking into purchasing surveying software for faculty, and we’ll be using that tool. That’s a big thing that will be different. The university was insistent that we use a purchased software program and not use a hosted survey for security reasons.

What key lessons did you learn from this survey that our readers should know?

The most important lesson we learned is that we will allow more time.  I thought we had allowed a lot of time, but we could have used more.

I wish we had had the money to pass the survey by someone like you.  But until the surveys yield some benefit, our management is not likely to put money into the program.

That’s an interesting Catch-22 problem that many people confront. If management isn’t willing to invest in the survey, then they’ll never see the benefits. But if they don’t see benefits, then they won’t invest the necessary resources.

Any final thoughts?

The things I remember most from your book. First, create a budget. Second, allow enough time to do it right. Those proved to be so true for our program, and no one should underestimate the time to create a good survey.

Thanks for sharing, Joyce.

Home Depot Transaction Survey

Summary: Transactional surveys are a good method for tracking the quality of service delivery in near real time. The concept is quite simple. After some transaction is complete, you ask the customer of the transaction to provide feedback. They should be short and sweet, but the Home Depot transactional survey is anything but short, imposing high respondent burden. The hook to get you to complete the survey is a raffle entry, but given the many shortcomings of the survey design — including a truly egregious set of instructions for aspects of the transaction not actually experiences — are the data valid?

Note: This article was written in 2007. Since then, the survey has changed somewhat from what is described here. While the survey used in 2012 as I write this is shorter, it is still quite long for a transactional survey, and most surprisingly, the egregious instructions are even more front and center for the respondent.

Note: If you have landed on this page because you ran a search on “Home Depot Survey,” please note that you are NOT on the Home Depot website.

~ ~ ~

If you’ve shopped  at a Home Depot — or Staples or even the Post Office — you may have noticed an extra long receipt. The receipt includes an invitation to take a “brief survey about your store visit” with a raffle drawing as the incentive. Seems simple. Why not do it?

The Home Depot customer satisfaction survey is a classic example of an transactional or event survey. The concept is simple. When customers — or other stakeholders — have completed some transaction with an organization, the customer gets a survey invitation to capture  their experiences. These transactional surveys typically ask questions about different aspects of the interaction and may have one or two more general relationship questions. Event surveys will also have a summary question about the experience, either at the start or the end of the survey. Reichheld’s Net Promoter Score® approach is an example of an event survey program.

Transactional Event Surveys as a Quality Control Tool

The most common application for event surveys is as a customer service satisfaction surveys. Why?  It’s perhaps the most efficient and effective method for measuring the quality of service from the most critical perspective — that of the customer.

A transactional survey is a quality control device. In a factory, product quality can be assessed during its manufacture and also through a final inspection. In a service interaction, in-process inspection is typically not possible or practical, so instead we measure the quality of the service product through its outcome. However, no objective specifications exist for the quality of the service. Instead, we need to understand the customers’ perception of the service quality and how well it filled “critical to quality” requirements — to use six sigma terminology. That’s what an event survey attempts to do.

An event survey has another very important purpose: complaint solicitation.  Oddly to some, you want customers to complain so can you resolve the problem. Research has shown that successful service recovery practices will retain customers at risk of switching to a competitor.

But the Home Depot transactional survey is a good-news, bad-news proposition.  The goal of listening to customers is admirable, but the execution leave a lot — a whole lot — to be desired. The reason is simple. The Home Depot survey morphs from an event survey to a relationship survey. And it is loaded with flaws in survey questionnaire design.

Relationship Surveys — a Complement to Event Surveys

In contrast to an event survey that measures satisfaction soon after the transaction is complete, a relationship (or periodic) survey attempts to measure the overall relationship the customer — or other stakeholder — has with the organization. Relationship surveys are done periodically, say every year. They typically assess broad feelings toward the organization, whether products and services have improved over the previous period, how the organization compares to its competitors, where the respondent feels the organization should be focusing its efforts going forward, etc.  Notice that these items are more general in nature and not tied to a specific interaction.

Relationship surveys tend to be longer and more challenging for the respondent since the survey designers are trying to unearth the gems that describe the relationship. But unless the surveying organization has a tight, bonded relationship with the respondents, a long survey high in respondent burden will lead to survey abandonment.

The Home Depot Customer Satisfaction Survey — Its Shortcomings

If you’ve taken the Home Depot survey, you probably found yourself yelling at the computer. The survey purports to be an event survey. The receipt literally asks you to take a “brief survey about your store visit.” Like the Energizer Bunny, though, this survey keeps going and going and going…

When I took the survey, having bought a single item for 98 cents, it took me between 15 and 20 minutes — far too long for a “brief” transactional survey. And I suspect it could take some people upwards of an hour to complete.

Why so long? First, the design of the transactional aspects and second, it transitions into a relationship survey. In my Survey Workshops and conference presentations, I may mention the Home Depot customer satisfaction survey, and all who had taken the survey were unanimous in their feelings about it. Respondents were frustrated; it took forever to get through the survey.

First, the design of the transactional aspects. One of the early questions asks you what departments you visited. Sixteen departments are listed! When I took this survey, I had stopped quickly at Home Depot for one item, but a modest home project could involve electrical, hardware, fasteners, building materials, etc.

This checklist spawns a screen full of questions about each department visited. This is known as looping since the survey loops through the same questions for each department. Looping is a type of branching where a branch is executed multiple times piping in the text for the name of each department.

See how the survey can get very long very quickly? (I knew it was a very long and complicated survey when I clicked on the drop down box on my browser’s back button and saw web page names like “Q35a” and “Q199”.)

home-depot-survey-plumbing
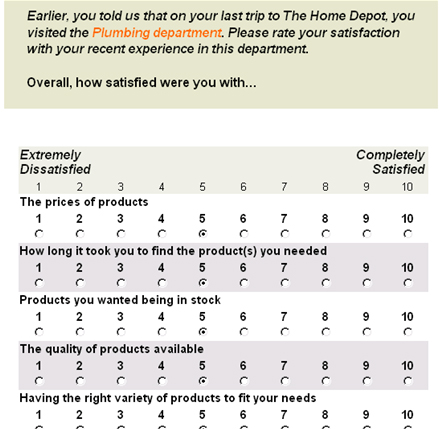
Second, the designers also make the survey feel longer by their survey design. They chose to use a 10-point scale. (See the example nearby.) Now when you think about the helpfulness of the associate in the plumbing department, can you really distinguish between a 6, 7, and 8 on the scale? Was it such an intense interaction that you could distinguish your feelings with that level of precision? Of course not. The precision of the instrument exceeds the precision of our cognition. This is like trying to state the temperature to an accuracy of 2 decimal points using a regular window thermometer! But the request for the precision lengthens the time for the respondent to choose an answer — with likely no legitimate information gain. People ask me, “how many points should a survey scale have? Isn’t more points better?” Not if the added respondent burden exceeds the information gain.

Third, the scale design is wrong. The anchor for the upper end of the scale is Completely Satisfied; whereas, the lower end anchor is Extremely Dissatisfied. In general, end-point survey anchors should be of equal and opposite intensity. These aren’t. Also, the Completely Satisfied anchor corrupts the interval properties of this rating scale. “Completely” makes the leap from 9 to 10 larger than any other interval. (Mind you, this survey design was done by professionals. You novice survey designers, take heart!)

home-depot-survey-error
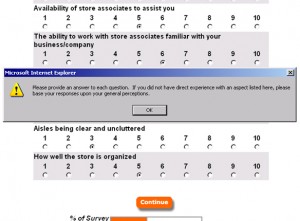
Fourth, the survey designers explicitly want you to add garbage to their data set! A response is required on every question, grossly increasing respondent burden. Plus, some of the questions simply are not relevant to every shopping visit. Look at the example below for the error message you’ll receive if you leave an answer blank.

If you do not have direct experience with an aspect listed here, please base your responses upon your general perceptions.

So, some of the survey responses will generate data about the store visit and other responses will generate general data based on the Home Depot image!  Please tell me the managerial interpretation of these data? How would you like to be the store manager who is chastised for surveys on visits to your store when some of the data are based upon “general perceptions”! (If you know a store manager, please ask them how the survey results affects his/her job.)

Some survey design practices are based on the personal preference of the survey designer. Other practices are just plain wrong. This practice — in addition to some other mistakes — is beyond plain wrong.

A primary objective in survey design is for every respondent to interpret the questions the same way. Otherwise, you’re asking different questions of different respondent subgroups. On which variation of the question do you interpret the results? Here, the survey design  poses different interpretations of the questions to respondent subgroups — and we don’t know who did which! Quite simply, the data are garbage — by design!

[While Home Depot has modified its survey from when we first posted this article, those instructions remain. In fact, the instructions are in the introduction of the survey!]

home-depot-survey-associates

Fifth, the survey is clogged with loads of unnecessary words that lead to survey entropy. Look at the screen about the Associate. The survey designers could restructure the survey design with a lead-in statement such as, “The Associate was…” for the entire screen. How many words could then be eliminated? The remaining words would be the constructs of interest that should be the respondent’s focus. To borrow a concept from engineering, the noise-to-signal ratio can be improved. Even the scale point numbers don’t need to be repeated for every question. That’s just more noise.

The Event Survey Run Amuck

After the truly transactional questions, the survey then morphs into a relationship survey. Where else do you shop?  What percentage of your shopping do you do in each of those other stores? How much do you spend? What are your future purchase intentions? And on and on and on.

Survey length has several impacts upon the survey results. First, it’s certainly going to impact response rate, defined as the number of people who start and complete the survey.

Second, the length will create a non-response bias, which results when a subset of the group of interest is less likely to take the survey. I can’t imagine a building contractor taking the time to do this survey.

Third, the survey length activates a response bias of irrelevancy.  The quality or integrity of the responses will deteriorate as respondents move through the survey. People go through the scores of screens to enter a raffle to win a $5000 gift certificate as promised on the survey invitation on the receipt. Of course, the raffle entry is done at the last screen. (Note: one prize is drawn each month, and according to the Wall Street Journal, Home Depot receives about a million surveys each month. If so, then the expected value of your raffle entry is one-half penny!)

As screen after screen appears and you feel you’ve invested so much time, you’re determined to get into that raffle. But what happens to how you approach the questions? You just put in any answer to get to the next screen. And if you think a particular answer might spawn a branching question, for example, by saying you were unhappy about something, you avoid those answers. I know I was not unique in this reaction. I quizzed people who took the survey without leading them toward this answer. That is the reaction this absurdly long survey creates.

~ ~ ~

Since I first wrote this article, the Wall Street Journal reported in a February 20, 2007 article on Home Depot’s woes, “Each week, a team of Home Depot staffers scour up to 250,000 customer surveys rating dozens of store qualities — from the attentiveness of the sales help to the cleanliness of the aisles.” After reading this article, how sound do you think their business decisions are?

Event Survey Practical Points

If you’re looking to create a survey used for capturing customer feedback about completed events of transactions, here are some practical points.

Keep It Short. If you want to get a good response rate, then keep it short and sweet — the ol’ KISS logic. For most transactional processes, 7 to 12 questions should be sufficient. You MUST resist the temptation to turn into an “all things for all people” survey — or more appropriately, “all things for all departments” survey. Every department will want a piece of your action. Say “NO” early and often. It’s either naiveté or sheer arrogance on the part of the survey designers to believe that they can get — or con — a respondent into taking a long survey and generate legitimate answers.

Use Random Sampling. If you have ongoing transactions with a customer base, you probably don’t want to send a survey invitation to everyone every time they have had a closed transaction. This will promote “survey burnout” and lead people to completing the survey only when they have an axe to grind — the so-called self-selection, non-response bias. Instead, randomly select people from the list of closed transactions. You will need some administrative controls over this list management to ensure you don’t overly survey certain people.

In the Home Depot case, random sampling really isn’t in play since this is an event survey with a point-of-contact survey administration method. They could generate the survey invitation randomly on the receipts, but survey burnout isn’t caused by repeated invitations but by the survey length.

Implement a Service Recovery (Complaint Handling) System Concurrent with the Event Survey Program. Complaint handling and event surveying are tightly linked. They’re complementary elements in a customer retention program. If a customer voices a complaint in a survey and you don’t respond, how’s the customer going to react? Obviously, you’ve just flamed the fires of dissatisfaction. A Yahoo web page has the following comments about the Home Depot survey:

home-depot-comments
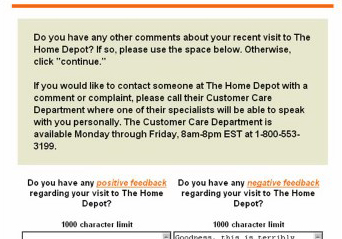
Towards the end it asks for comments. I gave some comments then asked if anyone actually reads these comments. I gave my email address, and asked for a reply, but no one ever replied. I figured I’d at least get a form reply. Do you think anyone actually reads the comments in surveys like these?

[reply to the post] I did the same thing when I took the survey. I had a lot of bad comments and asked for a reply. No response. I will go to my local hardware store next time. It just seems like HD has gotten too big, almost like Walmart. (sic)

The comment screen on the Home Depot survey does say that if you have issues you would like addressed to call its Customer Care Department, providing the toll-free number. But do customers recognize — or care — that the survey program is not linked to the customer service operation? Of course not. Try explaining to a customer why entering a comment like the ones above is not equivalent to contacting customer service. You’ll get glazed looks back. This practice demonstrates inward-out thinking, not outward-in thinking. (And if we’re on Daylight Savings Time, exactly what are the hours for Customer Care?)

Consider Different Survey Administrative Methods. Transactional surveying can be done by telephone, web form, paper sent through postal mail, or using the IVR if you’re in a call center operation. Since this is a quality control tool, you want to get your data as quickly as possible to act on any business process issues. Postal mail surveys are notoriously slow. Telephone surveys are expensive. Web form surveys are fast and inexpensive once the system is set up, but your target audience must have web access and be web savvy. Could Home Depot be introducing an administrative bias through web surveying?

How Often & How Soon to Survey. In the Home Depot point-of-contact survey approach, the surveying is essentially done at the close of a transaction. In situations where you have a data base of customer contact information, you could do the surveying in batch mode, say, every day or every week. Weekly is the typical period. If you let the period be too long, say monthly, the respondents’ recall will be poor, and you increase the probability of a process problem affecting yet more customers until you learn about the problem through your survey.

Outsource Surveys Versus In-House Execution. Many surveying services exist that will conduct the survey program for you. They may give you real-time access to the results through a web portal, and they may give you comparative statistics with other companies in your industry. But you will pay for these features. Transactional surveys can readily be done in house, but don’t short change the design and set-up. You need to have some level of dedicated focus in a program office to make it happen. You also must protect the confidentiality of any survey information about employee performance.

Pilot Test Your Surveys. A survey is a product that you as the survey designer should test before launching, just as a company should test any product before making it and selling it to customers. The pilot test or field test is critical to finding out the flaws in the detail of the survey design and in the overall design, like its length. If the Home Depot survey was pilot tested, it was an ineffectual test.

Don’t Abuse The Survey and Your Respondents. Please know the difference between an event survey and a relationship survey, and be humble in your request for your respondents’ time. By attempting to make the survey serve two masters — the event and the relationship — you’ll compromise on both. By shooting for the stars in terms of the information you demand, you may just get nothing. Or worse than nothing — made-up responses just to get to the raffle.

The One Number You Need to Know: (Actually There’s More Than One)

The December 2003 Harvard Business Review article, “The One Number You Need to Grow,” by Frederick Reichheld is one of those articles with “legs.” (The article’s title is sometimes abbreviated to “The One Number to Grow”. A more in-depth treatment is found in his book, The Ultimate Question.)  More than a decade after its publication colleagues still ask me about it, professional associations refer to its “net promoter score” (NPS), and students cite it in their papers.

A title like that should make anyone skeptical, and with no disrespect to Mr. Reichheld, the title of his article, while snazzy, doesn’t do justice to the content of his research and may lead readers to the wrong conclusion. The article has been misinterpreted as “The One Number You Need to Know.” (A colleague of mine actually made that mistake unintentionally in a blog post of his, since corrected.) In fact, knowledge of more than one number is needed to grow a business. A robust customer feedback program is needed.

The article opens with Reichheld hearing the CEO of Enterprise Rent-A-Car, Andy Taylor, talk about his company’s “way to measure and manage customer loyalty without the complexity of traditional customer surveys.” Enterprise uses a two-question survey instrument; the two questions are:

  1. What was the quality of their rental experience, and
  2. Would they rent again from Enterprise.

This approach was simple and quick, and we can infer from other comments in the article the survey process had a high response rate — though none is stated. Enterprise also ranked (sic) its branch offices solely using the percentage of customers who rated their experience using the highest rating option. (Again, we don’t know the number of response options on the interval rating scale. I’ll guess it was a 1-to-5 scale and not a 1-to-10 scale.) Why this approach?  Promoting branches to satisfy customers to the point where they would give top ratings was a “key driver of profitable growth” since those people had a high likelihood of repeat business and of recommendations.

Reichheld, thus intrigued, pursued a research agenda to see if this experience could be generalized across industries. His study found “that a single survey question can, in fact, serve as a useful predictor of growth.” The question: “willingness to recommend a product or service to someone else.” The scores on this question “correlated directly with differences in growth rates among competitors.” (my emphasis) This “evangelic customer loyalty is clearly one of the most important drivers of growth.”

From personal experience, I can state definitively that “willingness to recommend” as a sole survey question has a hole the size of a Mack truck. At the end of my Survey Design Workshops, not surprisingly, I survey my attendees. (I try not to imitate the story of cobbler and his barefoot children.) Many people, who are thrilled with the survey training class, are not willing to make a recommendation or serve as a reference. Why? Because their companies won’t allow it. Also, serving as a reference is work for the referrer, and the bond has to be incredible strong for the customer to take on that burden. In my survey training classes when discussing the use of attitudinal questions in a questionnaire design to summarize the respondents’ feelings, such as referenceability questions, I ask about this phenomenon. It’s quite common in a business-to-business environment, though it’s much less common in a consumer product environment.

Thus, the survey question written for willingness to recommend must be phrased correctly, that is, in a hypothetical sense, not as a request for some action.  For example,

If a colleague or friend should ask you for a recommendation on a <insert product or service>, how likely would you be to recommend us?

However, that’s not the question that Reichheld used in his study.  His question was:

“How likely is it that you would recommend [company X] to a friend or colleague?”

Reichheld noted late in the article that the recommendation question did not work well in certain industries, and the reasons discussed here are probably why.  But these issues are probably evident in all industries to some extent.

Reichheld then discusses customer retention rates and customer satisfaction scores as adequate predictors of profitability, but not of growth.  He correctly notes that many customers are retained by a company because they’re captive to high costs of switching to another product. Thus, a likelihood of repurchase survey question may mask underlying operational problems since dissatisfied folks might still be retained — but they certainly wouldn’t recommend.  However, I’ll guess an unhappy, but retained captive customer also has a low likelihood of completing any survey invitation.  More importantly, if you’re not retaining customers it’s awfully tough to grow!  So, measuring customer retention — and fixing identified core problems — is one element in a growth strategy.

He cites one of the Big Three car manufacturers not understanding why their customer satisfaction scores didn’t correlate to profits or growth. The reason is that these surveys are overtly manipulated by the car dealers and especially their salespeople. Remember the last time you bought a new car? The salesperson probably handed you a photocopy of the JD Power’s survey you’d be getting (with all the high scores checked off).  He explained to you that high scores would lead to an extra bonus payment for him — and those kid’s braces are expensive. New car surveys are perhaps the most egregious example of poorly conducted surveys.  Thus, it’s very tenuous to draw conclusions about the “most sophisticated satisfaction measurement systems” from that most unsophisticated example. In this regard, Reichheld is guilty of the same error as the car manufacturer who drew conclusions from poorly collected data.

With all this evidence, Reichheld advocates a “new approach to customer surveys.” A one-question survey “can actually put customer survey results to use and focus employees on the task of stimulating growth.” (my emphasis) His main conclusion is that a simple survey focused on willingness to recommend — or perhaps some other single measure in certain industries — is better than a more involved survey. “The goal is clear-cut, actionable, and motivating.” Not so fast!

This is where I part company with Mr. Reichheld.  To the contrary, knowledge of a customer’s willingness to recommend — alone — is not actionable survey data.

Notice some key terms cited earlier in the Reichheld study: “predictor of growth” and “correlated directly”.  A customer’s testimony about their willingness to recommend is not a cause of growth; rather, it’s a predictor since it’s closely correlated to growth, according to the study. (See below for more details on the exact study Reichheld performed.) Both revenue growth rates and the customer’s willingness to recommend are caused by customers’ experiences with the company’s products or services — positive or negative. That is, they both spring from a common source, as shown in the diagram below.

customer-experience-1

For data to be actionable, we have to learn where to take corrective action when goals are not achieved. Knowing a customer is not willing to recommend us does not tell us what root causes need to be addressed. (See Dr. Fred’s article on generating actionable data.) The relationship is not as depicted below. We cannot act on the willingness to recommend directly — except by manipulating a survey and generating questionable data as in the car dealer example.

customer-experience-2

To make this relationship clear, let me turn back to my experiences with my survey training classes. Let’s say that I ask only that recommendation question on my post-workshop survey, phrased correctly. What if I got low scores from a number of people? What would I do? I have no idea! Why? Because the one-question survey instrument design provides no information on what action to take.  Instead, I ask some very specific, very actionable, survey questions about attributes of the survey workshop, e.g., value of the content of various sections, value of the exercises, quality of instruction, and quality of the venue. I also ask people to provide specific details to support their scoring, especially for the weak scores. Combined with follow-up discussions, these data have helped me greatly refine the workshop materials.

net-promoter-primer
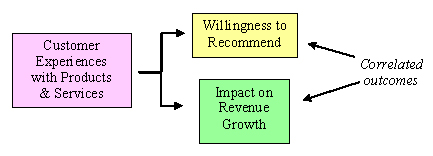
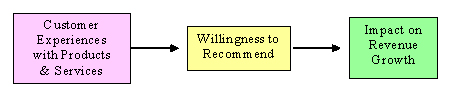
Let me be fair to Reichheld. At the end of the article he drops some critical pearls of wisdom about Enterprise’s survey system. It’s a phone survey, and information from unhappy customers is forwarded to the responsible branch manager, who then engages in service recovery actions with the customer, followed by root cause identification and resolution.

More importantly, in “A Net-Promoter Primer”, some critical information is presented. (See nearby image.) In addition to the willingness to recommend question that will serve to categorize the respondent, presumably at the start of the survey process, the survey contains “Follow-up questions [that] can help unearth the reasons for customers’ feelings and point to profitable remedies.” These questions should be “tailored to the three categories of customers”, meaning the survey should branch after the categorization question. This critical, practical information is presented in parentheses — yet there is nothing parenthetical about it!

To grow a business, you need to engage a customer feedback program that will predict at a macro level the course of your business. As a micro level, the feedback program must isolate the causes of customer dissatisfaction — and satisfaction. This information is vital to recovering at-risk customers and to performing root cause identification and resolution. It’s the improved business design and operational execution that leads to business growth.

Even Mr. Reichheld agrees There IS More Than The One Number You Need to Grow.

All quotations from “The One Number You Need to Grow,” Frederick Reichheld, Harvard Business Review, December 2003.

Reichheld’s Study Details

Here are more complete details of the study Reichheld and his colleagues at Satmetrix performed according to the article.  Some details are sketchy.

Administered Reicheld’s “Loyalty Acid Test” survey to thousands of people from public lists.  They “recruited” 4000 from these lists to participate.

They got these people to provide a purchase history, and asked when they had made a referral to a friend or colleague. If they didn’t have any referral information, the researchers waited 6-12 months and then asked these questions.

Built 14 “case studies” from the data where sufficient data allowed statistical analysis. Found which survey questions best correlated with repeat purchases or with referrals.

The willingness to recommend question was the best or second-best question in 11 of 14 case studies. Reichheld conjectures that the more tangible question of making a recommendation resonated better with respondents than the more abstract questions about a company deserving a customer’s loyalty.

The exact sequence of the project is a bit hazy here. They then developed a response scale to use with the recommendation question. They chose a 1-to-10 scale ranging from “extremely likely” to “not at all likely.”  It appears they performed cluster analysis – though there’s no mention of any statistics — on the data and found three clusters. “Promoters” would give scores of 9 or 10. “Passively satisfied” would score a 7 or 8 while “Detractors” would score 6 or below.

The next step was to see how well these groups would predict industry growth rates. Satmetrix administered the Recommendation Survey to thousands of people from public lists and correlated the results to companies’ revenue growth rates. Conclusion: no company “has found a way to increase growth without improving its ratio of promoters to detractors.” Again, you improve the ratio by improving the underlying product or service — and you need to know what to improve.

Generate Actionable Survey Data

When performing most any customer research, but especially when conducting customer satisfaction surveys, a key goal is to create “actionable data.” Why actionable? The end result of the research should be input to some improvement program or change in business programs or practices. If that’s not the goal, then why is the research being performed? (Hopefully, it not just to get a check mark on some senior manager’s Action Item list!)

However, mass administered surveys may not provide the detailed, granular data needed for taking action. Well-designed survey instruments use mostly structured, closed-ended questions. That is, these question formats ask the respondent to provide input on an interval scale, for example, a 1-to-5 scale, or by checking some set of items that apply to them for some topical area. These close-ended questions have two main advantages:

  • Ease of analysis for the surveyor. Since the responses are a number or a checkmark, there should be no ambiguity about the response. (Whether the respondent interpreted the question correctly is another issue.) The surveyor can mathematically manipulate the codified responses very easily. This is in contrast to open-ended questions that provide free-form textual responses. Analyzing all that text  is very time consuming and subject to interpretation by the survey analyst. (It’s also darn boring — but I don’t tell my clients that!)
  • Ease of taking the survey for the respondent. A key metric for a survey instrument lies in the degree of “respondent burden.” That is, the amount of effort required by the person completing the survey. Writing out answers is far more time consuming than checking a box or circling a number. Greater respondent burden à  lower survey response rates.

The closed-ended survey questions help paint a broad picture of the group of interest, but they seldom give details on specific issues — unless the survey contains a great many highly detailed questions, which increases the burden on the respondent through the survey length. Surveys typically tell us we have a problem in some area of business practice, but not the specifics of the customer experience that is needed for continuous improvement projects.

So, how can the detailed actionable data be generated — as part of the mass administered survey or as an adjunct in a more broadly defined research program? Here are some ways to consider getting better information:

  • Think through the research program and survey instrument design. I just mentioned above that actionable information can be generated through a detailed survey, one that asks very specific questions. But survey length becomes an issue.  Longer surveys will hurt response rates. Perhaps your research program can be a series of shorter surveys administered quarterly to very targeted — and perhaps, different — audiences.

    Additionally, examine any instrument critically to see if unnecessary questions can be eliminated or if questions can be structured differently to solicit the desired information from respondents more efficiently. For example, say you wanted to know about issues or concerns your customers have. A multiple choice question would identify if a customer had concerns for the items listed, but you don’t know the strength of the concern. Instead, consider using a scalar question where you ask the level of concern the customer has. It’s a little more work for the respondent, true, but not much. Yet, you may get data that is far more useful.

    Survey instrument design is hard work, but it’s better that the designer works harder than making the respondent work hard.

  • Judicious use of open-ended questions. As mentioned, an obvious way to generate detailed is to ask open-ended questions, such as, “Please describe any positive or negative experiences you have had recently with our company.” While some respondents will take the time to write a tome — especially on a web-form survey — those respondents without strong feelings will see this as too much work and give cryptic comments or none at all. Yet, their opinions are crucial to forming a broad — and accurate — profile of the entire group of interest.

    Novice survey designers typically turn to open-ended questions because they don’t know how to construct good structured questions. In fact, it’s a dead give away to a survey designer’s skill level! If you find you have to fall back upon open-ended questions, then you don’t know enough about the subject matter to construct and conduct a broad-based survey. It’s that simple.

    Some time ago I received a survey about a professional group that had 11 (yes, eleven!) open-ended questions in four pages. Recently, I received a survey about a proposed professional certification program. The first two questions were open-ended. And this latter survey was done by a professional research organization! Asking several open-ended questions is a sure fire way to get blank responses and hurt the response rate.

    That said, open-ended questions can generate good detailed data, but use them judiciously. One way they can be used appropriately leads to our next subject.

  • Use branching questions in the survey instrument. Frequently, we have a set of questions that we only want a subset of the target audience to answer either because of their background or because of some experiences they have or have not had. Branching means that respondents will be presented certain questions based upon their responses to a previous question that determine the “branch” a respondent follows. These are easiest to implement in telephone and web-form surveys where the administrator controls the flow of the survey, and most difficult to implement in paper-based surveys. (Don’t even think about uses branching on an ASCII-based email survey.) Some survey programs call these “skip and hit” questions.

    Branching can shorten the survey that a respondent actually sees, allowing for targeted detailed survey questions without unacceptable respondent burden. For example, if a respondent indicates he was very unhappy with a recent product or service experience, a branch can then pose some very specific questions.

    As alluded to above, the branch may lead to an open-ended question. But beware! An audience member at a recent speaking event of mine had encountered a survey where a pop-up window appeared with an open-ended question whenever he gave a response below a certain level, say 4 on a 1 to 10 scale. He found these pop-ups annoying — don’t we all! So, he never gave a score below five. Talk about unintended consequences! The survey designer created a false upward bias to the survey data!

  • Use filtering questions in the analysis. When we get a set of survey data, we will always analysis it as a whole group, but the real meat may be found by analyzing the data segmented along some variables. These filtering questions may be demographic variables (e.g., size of company, products purchased, years as a customer, age, and title). Those demographic data could come from questions on the survey or they could come from our database about those whom we just surveyed. (This presumes that the survey is not anonymous.  If it is, then we have no choice but to ask the questions. But, again, beware! Demographic questions are imposing to the respondent. Too many of them will hurt response rate.)

    The filtering questions may also be response results from key questions on the survey. Just as the response on a question, such as satisfaction with problem resolution quality, could prompt an open-ended branching question, the results of that question may also be used to segment the data base for analysis. Basically, you’re looking for correlations or association across the responses to multiple questions to see if some cause-and-effect relationship can be identified. (Multivariate statistical procedures could also be used.)

  • Conduct pre- or post-survey interviews. Perhaps the best method or getting more actionable data is to expand the definition of the research program to include more than just a mass-administered survey. Every research technique has its strengths and its weaknesses. Surveys are good at painting profiles of some group.  Interviews and focus groups (also known as small group interviews) are very good at generating detailed, context-rich information. These data can help you understand cause-and-effect relationships by getting the full story of what’s behind the respondent’s feelings.  I’ll talk more about these in a future article.

    Such research techniques are frequently used at the start of a research program to understand the field of concern. This understanding then allows for a better designed survey instrument, but context-rich research also provides valuable information about the subject area. There’s a double benefit to this research. But there’s nothing that says these interviews can’t be used at the back-end of the research program as a follow-up to the mass administered survey. Surveys frequently pose as many new questions as they answer, and this is a method for answering those new questions. In fact, you might be able to generate the interview list on your survey. When you pose an open-ended question, offer to contact the person to talk about their issue in lieu of having them write in their comments. In essence, that creates an opt-in list from highly motivated people.

Unfortunately, no silver bullet exists for getting actionable customer feedback data. Research programs have inherent trade-offs, and this article outlined some of the critical ones.

Keys to a Successful Survey Project

I do about a dozen speaking engagements each year on customer surveying tools and techniques. Obviously, the people attending have a genuine interest in conducting surveys, or improving their current surveying process. During the presentations or in discussions afterwards, I have an opportunity to learn about the attendees’ surveying efforts.

I’m always struck by the organizational duplicity applied to customer surveying — or just about any program designed to learn from customers. Many organizations say on one hand, “Our customers are very important, and we need to listen to them to learn how we can better serve them.” But on the other hand, “We will do the customer surveying effort with current resources and fit it into the staff’s current duties.” This latter tendency is especially predominant for internal help desks, which are frequently resource starved.

This is a clear recipe for inaction. Support by its nature is reactive and solving the customer’s problem always takes priority. Longer term projects, such as a customer survey effort, will get put on the back burner, perhaps to wither through neglect. (I am familiar with a company that spends millions to gauge the satisfaction of its external customers, but won’t spend a dime for the internal help desk to survey its customers.)

Why is this? I can only conjecture that the payoff from surveying seems nebulous – in contrast to projects that target improved efficiency and cost reduction. Perhaps a surveying project seems so simple to senior management that the need to commit resources isn’t obvious.

Let me outline the keys I’ve learned for a successfully managed customer surveying project.

  • Dedicated project management focus. Treat a surveying project — as a project. This circumlocution has a point. A survey project requires all the management discipline that we would apply to any other project.
  • Adequate and proper resources assigned. Most important, you need a project manager, whether you are doing the effort entirely internally or whether you intend to outsource part of it. Project management duties will consume from 25% to 100% of this person’s time, depending on the degree of outsourcing and how quickly you want to get the survey underway.You will also need a project team composed of representatives from the groups that will be affected by the surveying effort. If you are developing the survey instrument yourself, this team will play a vital role in the instrument design stages. The team should be meeting weekly or bi-weekly, so build this into the team members’ job plans.
  • Sufficient budget. In addition to the people, some other expenditures will be incurred. Don’t be penny wise and pound foolish. You could do an entire surveying effort without spending a cent on productivity aids or outsourcing. You can format a survey instrument using a word processor, send it out in hardcopy, manually key in the results and analyze the data with a spreadsheet. Aside from postage and envelopes, there is little direct cost. I’ve done this! It works! It’s also very time consuming, not to mention boring. This budget plan greatly increases the labor effort, and if the team is not properly committed (see #2), then you’ll complete the project sometime later this century.Alternatively, you could bring in resources for key components of the project, such as project design or administration, or you may invest in a survey automation tool that will greatly cut the cost of administration. These tools cost from a few hundred dollars to a few thousand, depending upon the breadth of features you want. They are not a “silver bullet” as they have their shortcomings, which I’ll address in a future article, but they will pay for themselves in the first use.Of course, you can also outsource the survey design effort and/or the survey administration. (Remember, your core competency is not conducting surveys!) The price tag may seem high, but the cost of doing it wrong — especially in the design of the survey instrument – is much less than the cost of doing it right. After all, you want accurate data, don’t you?
  • Well-developed schedule or plan. If you’ve never done a survey project, it will probably seem simple – deceptively simple. At a high level, the stages are: project planning, instrument design, survey administration, data analysis and implementing results. Within each stage, there are many inter-related individual tasks to accomplish These may involve a number of people in the organization, so a good plan is essential to keeping the project on track.
  • Clear statement of purpose for the survey. When you start the survey project (or any project), the first question you need to answer is: why am I doing this? Is the survey’s purpose to identify customer needs, exercise operational control, identify shortcomings in the process design, or prove the value of your support organization? If you can’t develop a cogent, one paragraph statement of your survey project’s purpose — or worse, you’re doing it because you were told to do it — then the project is in trouble before it even begins. I’ve seen projects that tried to serve too many masters and wound up serving all of them poorly. When you tell people that you’re doing a survey, it’s like winning a lottery. You’ll find you have lots of new friends. You’ll hear, “Since you have the customer on the phone, could you ask them…” Resist the temptation. A survey should be focused on a few limited objectives.Recognize that the statement of purpose is not locked in stone. As you proceed with your research for designing the instrument, you may change your focus, but always come back to your statement of purpose and amend it.
  • A sponsor to beat the path. All projects have political elements and a survey project is no different. You need a sponsor in senior management to work issues, budgetary and otherwise. This person will probably also be the person who signs the letter soliciting people to participate in the survey.
  • Understanding of survey methodology. If you’re going to do the survey effort yourself, then you will need to become very knowledgeable of survey techniques. There’s more to designing a good instrument than meets the eye. There are a number of good surveying books. (Of course, I consider my own book on customer surveys best for the novice to intermediate surveyor.) You should also consider getting survey workshop training. Even if you plan to outsource most of the project, you’ll be better able to manage the outsourcers the more you know about the topic.

Accomplishing these steps does not guarantee success, but you’ll have a much easier and fruitful sailing though your survey project if you apply the above lessons.