Summary: The choice of a survey scale impacts setting performance goals. Scale choice and question wording will affect the way people respond. The article also discusses why (artificially) high scores are not necessarily good — if your goal is to use the survey results for continuous improvement projects, requiring Pareto Analysis.
~ ~ ~
A previous article focused on how best to set performance goals based on results from surveys. Is it better to set a goal based on the percentage of respondents who gave “Top Box” scores or it better to use an average? As with many issues, there is no clear cut answer. That article prompted an email from Cathy Switzer, Director, Customer Support Services, of FileMaker, Inc. who asked:
When we spoke a few months back regarding expected survey scores, I was aggregating scores (scale of 1 low to 5 high) and taking an average. I’ve rerun stats to calculate the total count of “5” responses, the total count of “4” responses, etc.
Respondents who gave us a 5 range from a high of XX% to a low of YY%. Naturally, my question — what is an acceptable goal to receive the top rating? I’d like to see 90% at the top rating, but realize that that may be too high an expectation! So I turn to you for guidance on setting a goal %.
Here’s my response:
There is no iron-clad goal for the % of 5s. The wording of the questionnaire, scale choice, and the anchor choices will make a big difference, a VERY big difference. The real goal is for a positive trend over time. In fact — and this will seem counter-intuitive — there’s a strong argument for using wording that leads to a lower % of top box scores. Why? It helps you measure improvement.
When I worked for Digital Equipment Corp,, virtually all field service branches scored in the 8.8 to 9.3 range (on a 1 to 10 scale) in their annual survey. Realistically, how can you improve? (There were other issues with that survey program, too.) I personally lean towards scales with good dispersion properties — but I’m not measured on the results!
Survey Scale Design Impact on Responses
Let’s first consider the impact of the questionnaire design and in particular the scale chosen for the survey questions. Look at the following two scale design options that could be used on a customer satisfaction survey:
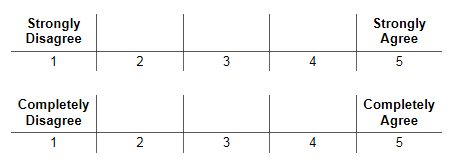
You likely have encountered these scale types in surveys. They are known as a Likert-type scale — after its creator — or more commonly known as a “strength of agreement” scale. The surveyor poses a statement and asks respondents how strongly they agree with the statement. Note that the scale could have a different number of points, an even versus odd number of points, or have descriptive words, known as “anchors” over every point on the scale. Those differences are not my concern here.
Let’s focus on the anchors used for the endpoints on the scale. Imagine after staying in a hotel you were posed with the survey question or statement, “The service I received was excellent.” What if every aspect of your stay was superb, but one small problem occurred, perhaps room service dirty dishes stayed in the hallway for far too long.
On which scale would you be likely to give a 5 rating? Note that the second scale has an extremely high threshold for giving a 5 (or a 1). That scale is less likely to get ratings on the endpoints due to the absolute requirement expressed in the anchors.
My point with this example is that scale design and anchor choice will influence respondents’ ratings — both higher and lower. This is a key reason why I’m skeptical of the cross-company benchmarking where each company is using a different survey instrument. So many variables are in play that legitimate comparisons are quixotic.
Survey Scale Design, Dispersion, and Trend Lines
Let’s assume for a moment that the purpose of the survey is not to gild your performance reviews, but instead is meant to identify areas for improvement.

Survey Training Classes
Running your own survey programs? Learn how to do it right from us — the premier worldwide trainers for survey design & analysis.
Featured Classes:
(Being a surveyor in many ways is like being an accountant. Tell me what numbers you want and I can deliver them to you!)
If all the scores are clustered on the high end because of some quirk of questionnaire design, how can you identify where to focus improvement efforts? Those with background in quality management know the goal of Pareto Analysis: separate the critical few from the trivial many. With no dispersion, the critical few are hidden.
Survey Scale Design Experiment
So what scale designs lead to dispersion? We experimented with several different scale designs measuring the same attributes. The different questionnaires were posed randomly to 10,000 respondents on a telephone survey.
We found:
- Providing a numeric scale with anchors only for the endpoints — for example, a 1 to 5 scale was presented with verbal descriptions only for the 1 and 5 endpoints — led to more people choosing the endpoints, probably because that’s what they heard. This truncation effect may be lessened on a web form or paper survey since the respondent would visually see the entire scale.
- Conversely, presenting a scale as a series of verbal descriptions — for example, “Are you extremely satisfied, very satisfied, somewhat satisfied, somewhat dissatisfied, very dissatisfied, or extremely dissatisfied?” — lead to more dispersion and less clustering of responses.
- Similarly, a school grade scale led to more dispersion. A school grade scale is where you ask the respondent to grade performance on an A, B, C, D, and F scale. Apparently, grade inflation doesn’t affect surveys!
Here’s another scale I’ve used that has good dispersion properties. I call it a Met Expectations scale.
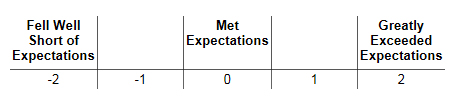
If the perceptions matched the expectations, then the response should fall in the center of the scale. The numbering scheme, while still a 5-point scale, reinforces the midpoint as an average position. However, this scale is a challenge to present to management. I recall telling my anxious client when I ran my first numbers on the survey data set that the company scored a 1.1 on the overall satisfaction question! It doesn’t sound anywhere near as impressive as a 4.1 on a 1-to-5 scale.
Summary of Survey Scale Design Lessons
Scale design has a huge impact upon how respondents will answer a question. Thus, a performance measurement system will be greatly affected by the questionnaire design. Goals have to be set cognizant of the questionnaire.
Also, the goals of a performance measurement system using surveys — where higher scores are wanted — can compromise the role of that same survey program in identifying areas for quality improvement where we want a dispersion of responses to separate out the “critical few” on which to focus attention.

Customer Experience Management
We evaluate clients’ current feedback processes and drive improvements for customer recovery and bonding.
Featured Services:

Survey Consulting
We assist clients with their survey projects ranging from a self-help guidebook, to targeted assistance, to full service solutions.
Featured Services: