Home Depot Transaction Survey
Summary: Transactional surveys are a good method for tracking the quality of service delivery in near real time. The concept is quite simple. After some transaction is complete, you ask the customer of the transaction to provide feedback. They should be short and sweet, but the Home Depot transactional survey is anything but short, imposing high respondent burden. The hook to get you to complete the survey is a raffle entry, but given the many shortcomings of the survey design — including a truly egregious set of instructions for aspects of the transaction not actually experiences — are the data valid?
Note: This article was written in 2007. Since then, the survey has changed somewhat from what is described here. While the survey used in 2012 as I write this is shorter, it is still quite long for a transactional survey, and most surprisingly, the egregious instructions are even more front and center for the respondent.
Note: If you have landed on this page because you ran a search on “Home Depot Survey,” please note that you are NOT on the Home Depot website.
~ ~ ~
If you’ve shopped at a Home Depot — or Staples or even the Post Office — you may have noticed an extra long receipt. The receipt includes an invitation to take a “brief survey about your store visit” with a raffle drawing as the incentive. Seems simple. Why not do it?
The Home Depot customer satisfaction survey is a classic example of an transactional or event survey. The concept is simple. When customers — or other stakeholders — have completed some transaction with an organization, the customer gets a survey invitation to capture their experiences. These transactional surveys typically ask questions about different aspects of the interaction and may have one or two more general relationship questions. Event surveys will also have a summary question about the experience, either at the start or the end of the survey. Reichheld’s Net Promoter Score® approach is an example of an event survey program.
Transactional Event Surveys as a Quality Control Tool
The most common application for event surveys is as a customer service satisfaction surveys. Why? It’s perhaps the most efficient and effective method for measuring the quality of service from the most critical perspective — that of the customer.
A transactional survey is a quality control device. In a factory, product quality can be assessed during its manufacture and also through a final inspection. In a service interaction, in-process inspection is typically not possible or practical, so instead we measure the quality of the service product through its outcome. However, no objective specifications exist for the quality of the service. Instead, we need to understand the customers’ perception of the service quality and how well it filled “critical to quality” requirements — to use six sigma terminology. That’s what an event survey attempts to do.
An event survey has another very important purpose: complaint solicitation. Oddly to some, you want customers to complain so can you resolve the problem. Research has shown that successful service recovery practices will retain customers at risk of switching to a competitor.
But the Home Depot transactional survey is a good-news, bad-news proposition. The goal of listening to customers is admirable, but the execution leave a lot — a whole lot — to be desired. The reason is simple. The Home Depot survey morphs from an event survey to a relationship survey. And it is loaded with flaws in survey questionnaire design.
Relationship Surveys — a Complement to Event Surveys
In contrast to an event survey that measures satisfaction soon after the transaction is complete, a relationship (or periodic) survey attempts to measure the overall relationship the customer — or other stakeholder — has with the organization. Relationship surveys are done periodically, say every year. They typically assess broad feelings toward the organization, whether products and services have improved over the previous period, how the organization compares to its competitors, where the respondent feels the organization should be focusing its efforts going forward, etc. Notice that these items are more general in nature and not tied to a specific interaction.
Relationship surveys tend to be longer and more challenging for the respondent since the survey designers are trying to unearth the gems that describe the relationship. But unless the surveying organization has a tight, bonded relationship with the respondents, a long survey high in respondent burden will lead to survey abandonment.
The Home Depot Customer Satisfaction Survey — Its Shortcomings
If you’ve taken the Home Depot survey, you probably found yourself yelling at the computer. The survey purports to be an event survey. The receipt literally asks you to take a “brief survey about your store visit.” Like the Energizer Bunny, though, this survey keeps going and going and going…
When I took the survey, having bought a single item for 98 cents, it took me between 15 and 20 minutes — far too long for a “brief” transactional survey. And I suspect it could take some people upwards of an hour to complete.
Why so long? First, the design of the transactional aspects and second, it transitions into a relationship survey. In my Survey Workshops and conference presentations, I may mention the Home Depot customer satisfaction survey, and all who had taken the survey were unanimous in their feelings about it. Respondents were frustrated; it took forever to get through the survey.
First, the design of the transactional aspects. One of the early questions asks you what departments you visited. Sixteen departments are listed! When I took this survey, I had stopped quickly at Home Depot for one item, but a modest home project could involve electrical, hardware, fasteners, building materials, etc.
This checklist spawns a screen full of questions about each department visited. This is known as looping since the survey loops through the same questions for each department. Looping is a type of branching where a branch is executed multiple times piping in the text for the name of each department.
See how the survey can get very long very quickly? (I knew it was a very long and complicated survey when I clicked on the drop down box on my browser’s back button and saw web page names like “Q35a” and “Q199”.)
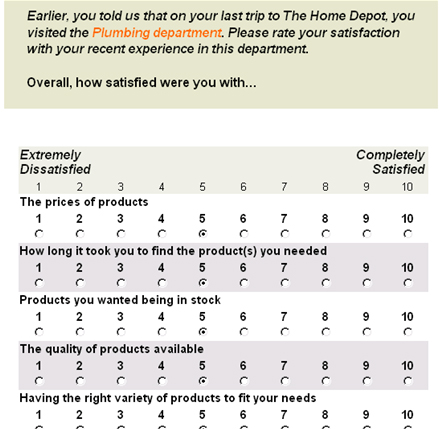
 Second, the designers also make the survey feel longer by their survey design. They chose to use a 10-point scale. (See the example nearby.) Now when you think about the helpfulness of the associate in the plumbing department, can you really distinguish between a 6, 7, and 8 on the scale? Was it such an intense interaction that you could distinguish your feelings with that level of precision? Of course not. The precision of the instrument exceeds the precision of our cognition. This is like trying to state the temperature to an accuracy of 2 decimal points using a regular window thermometer! But the request for the precision lengthens the time for the respondent to choose an answer — with likely no legitimate information gain. People ask me, “how many points should a survey scale have? Isn’t more points better?” Not if the added respondent burden exceeds the information gain.
Third, the scale design is wrong. The anchor for the upper end of the scale is Completely Satisfied; whereas, the lower end anchor is Extremely Dissatisfied. In general, end-point survey anchors should be of equal and opposite intensity. These aren’t. Also, the Completely Satisfied anchor corrupts the interval properties of this rating scale. “Completely” makes the leap from 9 to 10 larger than any other interval. (Mind you, this survey design was done by professionals. You novice survey designers, take heart!)
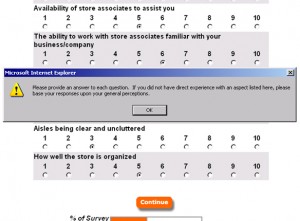
 Fourth, the survey designers explicitly want you to add garbage to their data set! A response is required on every question, grossly increasing respondent burden. Plus, some of the questions simply are not relevant to every shopping visit. Look at the example below for the error message you’ll receive if you leave an answer blank.
If you do not have direct experience with an aspect listed here, please base your responses upon your general perceptions.
So, some of the survey responses will generate data about the store visit and other responses will generate general data based on the Home Depot image! Please tell me the managerial interpretation of these data? How would you like to be the store manager who is chastised for surveys on visits to your store when some of the data are based upon “general perceptions”! (If you know a store manager, please ask them how the survey results affects his/her job.)
Some survey design practices are based on the personal preference of the survey designer. Other practices are just plain wrong. This practice — in addition to some other mistakes — is beyond plain wrong.
A primary objective in survey design is for every respondent to interpret the questions the same way. Otherwise, you’re asking different questions of different respondent subgroups. On which variation of the question do you interpret the results? Here, the survey design poses different interpretations of the questions to respondent subgroups — and we don’t know who did which! Quite simply, the data are garbage — by design!
[While Home Depot has modified its survey from when we first posted this article, those instructions remain. In fact, the instructions are in the introduction of the survey!]
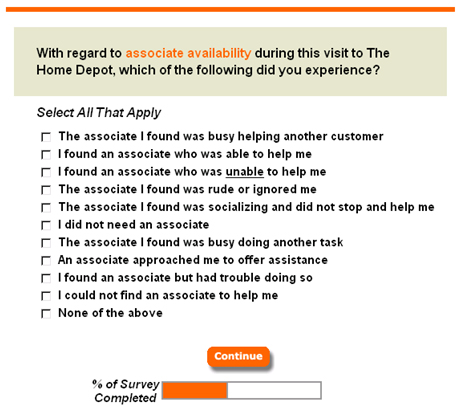
Fifth, the survey is clogged with loads of unnecessary words that lead to survey entropy. Look at the screen about the Associate. The survey designers could restructure the survey design with a lead-in statement such as, “The Associate was…” for the entire screen. How many words could then be eliminated? The remaining words would be the constructs of interest that should be the respondent’s focus. To borrow a concept from engineering, the noise-to-signal ratio can be improved. Even the scale point numbers don’t need to be repeated for every question. That’s just more noise.
The Event Survey Run Amuck
After the truly transactional questions, the survey then morphs into a relationship survey. Where else do you shop? What percentage of your shopping do you do in each of those other stores? How much do you spend? What are your future purchase intentions? And on and on and on.
Survey length has several impacts upon the survey results. First, it’s certainly going to impact response rate, defined as the number of people who start and complete the survey.
Second, the length will create a non-response bias, which results when a subset of the group of interest is less likely to take the survey. I can’t imagine a building contractor taking the time to do this survey.
Third, the survey length activates a response bias of irrelevancy. The quality or integrity of the responses will deteriorate as respondents move through the survey. People go through the scores of screens to enter a raffle to win a $5000 gift certificate as promised on the survey invitation on the receipt. Of course, the raffle entry is done at the last screen. (Note: one prize is drawn each month, and according to the Wall Street Journal, Home Depot receives about a million surveys each month. If so, then the expected value of your raffle entry is one-half penny!)
As screen after screen appears and you feel you’ve invested so much time, you’re determined to get into that raffle. But what happens to how you approach the questions? You just put in any answer to get to the next screen. And if you think a particular answer might spawn a branching question, for example, by saying you were unhappy about something, you avoid those answers. I know I was not unique in this reaction. I quizzed people who took the survey without leading them toward this answer. That is the reaction this absurdly long survey creates.
~ ~ ~
Since I first wrote this article, the Wall Street Journal reported in a February 20, 2007 article on Home Depot’s woes, “Each week, a team of Home Depot staffers scour up to 250,000 customer surveys rating dozens of store qualities — from the attentiveness of the sales help to the cleanliness of the aisles.” After reading this article, how sound do you think their business decisions are?

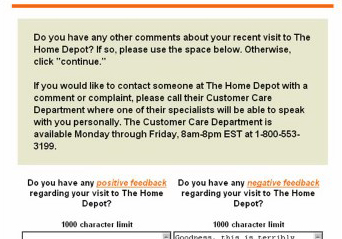
 Towards the end it asks for comments. I gave some comments then asked if anyone actually reads these comments. I gave my email address, and asked for a reply, but no one ever replied. I figured I’d at least get a form reply. Do you think anyone actually reads the comments in surveys like these?