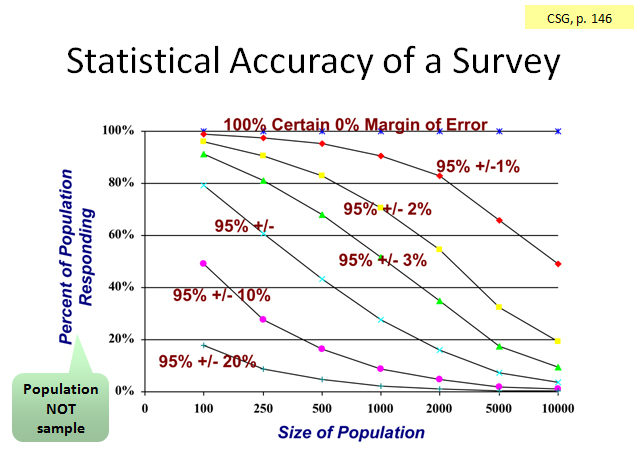
Let’s say our questions use an interval rating scale that ranges from 0 to 5 (so there are 5 equal intervals in the scale). If we get enough responses so we’re on the +/-10% curve, then we’re pretty certain the “real” answer (the population mean) lies no more than 10% from the mean score we got (the sample mean), which is half an interval (0.5) on either side of the mean.
More properly, if we conducted this survey 20 times, 19 out the 20 times (95%), we would expect the mean score to lie within +/-10% of the mean score found when we conducted the survey.
Take a deep breath and re-read the above…
Say you have a population of 1000, and you sent a survey invitation to 500 people. Half of those responded. So, 25% of the population responded. Find the intersection of 1000 on the horizontal axis and 25% on the vertical axis. You would be approximately 95% certain of +/-5% accuracy in your survey results.
Conversely, if we have an accuracy goal for the survey project, we can use this chart to determine the number of responses needed. Say we have that population of 500, and we wanted an accuracy of +/-10%. Then we would need about 18% of the population to respond, or 90. (Find those coordinates on the chart.)
By applying an estimate of our response rate, we can then determine the number of survey invitations we must send out, which is our sample size. If we estimated a 25% response rate, then we would need a sample size of 360. (360 x .25 = 90)
Take another deep breath and re-read the above…
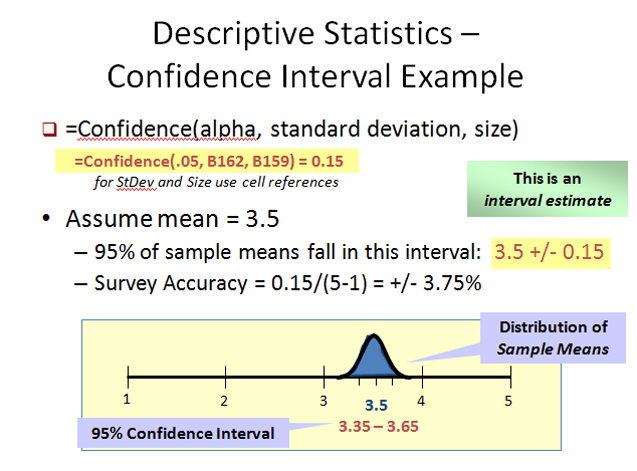
When we actually conduct our survey and analyze the results, we will then know something about the variance in the responses. The confidence statistic incorporates the variance found in each survey question and can be calculated for each survey question.
The confidence statistic tells us the size of the band or interval in which the population mean most likely lies – with a 95% certainty. (Technically, the interval tells us where the mean of repeated survey samples would fall. With a 95% certainty, 19 of 20 survey samples drawn from the population of interest would lie within the confidence interval.)

Look at the above chart. It shows the calculation of the confidence statistic using Excel. Alpha is likelihood of being wrong we’re willing to accept. (.05 or 5% being wrong is the same as 95% certainty we’re correct.) The standard deviation is square root of the variance, and can be calculated using Excel. Size is the number of responses.
In this example, the mean for the survey question was 3.5 on a 1 to 5 scale and the confidence statistic was 0.15. So, we’re 95% certain the true mean lies in a band defined by 3.5 +/-0.15. Our accuracy is 0.15 as a percentage of the size of the scale, which is 5-1=4. Thus, our accuracy is +/-3.75%.


