Summary: MassMove research on transportation priorities in Massachusetts does not have sound methodology and should not be used as the basis for decision making.
The research uses a self-selected, highly biased audience combined with leading information to get answers to support what are likely pre-determined conclusions. The survey questionnaire uses very weak survey methodology that further guarantees the “right” answers. Citizen input should be collected using sound, valid, reliable research methodologies.
Posted September 27, 2017
~~~
Today’s newscast included mention of a just-released report regarding transportation in my state — Massachusetts. It was based on a research study of citizen input using workshops and a survey. The headline finding on TV was that most people favor raising income taxes to support an improved transportation system rather than increasing tolls or fees.
I was intrigued. I went to MassMoves.org and read the study. Surprisingly since it stresses the citizen input, I had never heard of the study before. I consider myself a reasonably well-informed person. I watch 15-30 minutes of local news – actual news beyond weather and sports – each day. I don’t subscribe to a local paper, but I do get the Boston Globe’s daily email news summary. I also read our local weekly newspaper, beyond just the police blotter. Never heard of this study; never saw an invitation to participate.
MassMoves’ Biased Research Sample
The fact that I never heard of this research gets to the core issue with the validity of the findings: they used a very biased sample. (See my article on the Hidden Dangers of Survey Bias.)
The authors admit this on pages 7 and 8 of the report:
The noontime scheduling of the workshops may have prevented some residents from attending.
That’s quite an understatement! If you work a traditional 9-to-5 job, could you take off 2 hours plus transportation time to participate in a non-work-related focus group or workshop? In effect, they restricted the sampling frame to those people who do not work full-time day jobs.
Further:
Over 500 people participated in the nine regional workshops. As Table 2.1 shows, the workshops ranged in size from 37 in Central Massachusetts to over 100 in Western Massachusetts. The workshop participants were self-selected in that they were interested in transportation issues for a variety of reasons and volunteered to attend and participate. They were not a representative sample of Massachusetts’ residents. (Emphasis added.)
So, 20% of the subjects were from Western Massachusetts, a highly disproportionate sample. Did the researchers perform statistical adjustments to compensate for the lack of representativeness in the sample due to geography or other demographic characteristics?
More importantly, what are the details behind their sampling plan. How did they decide whom they would invite? How were they invited? Here’s what is reported:
Each workshop was open to anyone interested in attending and was publicized by the State Senate and by the local Regional Planning Agencies. (p.7)
Are the people on the mailing lists of state senators and the local planning agencies representative of the general populace? Of course not.
Such purposeful sampling is a perfectly acceptable sampling approach to achieve certain research goals. It is used for focus groups where the goal is to get a variety of viewpoints in the small group to generate a rich discussion.
However, purposeful sampling is by design not representative. It is not random sampling. Polling workshop attendees and publishing those results as speaking for the citizens of the Commonwealth is at best misleading.
Think these declaimers made the press release? I wish… They did not make the Executive Summary MassMoves published, and of course that’s what most people are going to read.
The Conduct of the Workshops
A total of 531 people provided data in this “study” (including all those pols who couldn’t resist “participating”). Not a bad number, but given the bias, should the findings be treated as anecdotal information or as valid, reliable research findings that form the basis for decision making? In other words, if another true research group attempted to measure the same issues, would they get the same findings? Doubtful.
As mentioned, workshops or focus groups are not research events where you measure opinions as representative of a general population. Workshops develop ideas and work towards solutions. In fact, that’s what supposedly transpired, according to the sessions flow as presented on page 8 of the report:
First, following a welcome and call to action by Senate President Stan Rosenberg and an overview of the workshop by the MassMoves facilitator, former Secretary of Transportation Jim Aloisi provided a snap-shot of Massachusetts’ current transportation system (see Chapter 2 for summary). (Emphasis added.)
The second portion of the workshop focused on transportation goals and priority actions for a 21st century transportation system for the state as a whole. After a brief presentation by the facilitator, participants—organized in small groups—discussed what goals and actions they thought were most important for the state, keying off lists of potential goals and actions prepared by the MassMoves team.
Workshop participants were then polled on the potential goals and actions (and other related questions) using keypad-polling devices, which allowed everyone in the room to see the polling responses for the full group. We also polled participants on their assessment of the current transportation system and how important they think it is for elected officials to take action. In preparing the lists of potential goals and actions for this session, the MassMoves team worked with an advisory group and separately with representatives from the Regional Planning Agencies.
This key-pad polling process may well have created a conformity bias.
Online postings and photos show that the work groups had facilitators that included state senators. Online postings said the session leaders posed questions in a way to lead people to pre-selected answers. Here are comments from participants:
Delphi methods employed to steer the group to a predetermined outcome. Nothing new, all of these meetings are similar and participants are used by the group facilitators to create the illusion of public buy in. (Michael W Dane)
I went to one of the “workshops” and agree with the comment that it was more focus group than conversation. There were only certain choices given and then we were polled – so you had to pick among what was offered. It certainly felt to me that it was mostly a marketing ploy. It felt like the people running the “workshop” tended towards certain solutions. (Susan Ringler, Transportation Working Group of 350MA)
I did not want to respond to your post, Stephen, in an attempt to be optimistic. The South shore meeting was essentially a ‘focus group’ session to evaluate what key words to avoid, in order to sell the MAPC product. (Mike Richardi)
So, having “conditioned” the participants with a call to action, background information, and work sessions facilitated by leaders with a decided point of view, participants were polled on concepts developed by advocacy groups. The data are presented as if generated from focus groups moderated by neutral facilitators. No so.
The workshops appear to be far more “information push” than “information pull” designed to lend the impression that “we got citizen input.” More on that in a bit.
Nonetheless, there’s some interesting data in the report. But they present statistics from the “polling” lending the impression that these are scientifically valid data generated from focus groups moderated by neutral facilitators. The results are not scientifically valid.
A footnote in the report adds this:
The workshop participant numbers listed in Table 2.1 reflect the number of participants who participated in the keypad polling, and do not include numerous out-of-region [state] Senators who attended but did not generally participate in that region’s polling, as well as Senate staff members and other observers. (Emphasis added; syntax and punctuation cloud interpretation here did and did not participate in the polling.)
So, it’s entirely possible that the results captured in the keypad polling done in the workshops included “votes” from state representatives and others, who were not part of the region.
In other words, measurement error layered on sampling bias.
The Survey Follow-Up to the Workshops
To compensate for the bias created by conducting the workshops when people work, they “distributed an online survey to residents who attended one of the evening Commonwealth Conversations sessions.” How were people invited to these Conversations? Again, a non-representative group.
The survey provided the headline findings regarding preferred funding approaches. Let’s look at that survey and its respondent group.
This report section starts out with this caveat:
Note that those who participated online did not have the benefit of participating in the interactive regional workshops, including the informative background presentations or the discussions with other participants about most of the topics prior to the polling. (Emphasis added.)
In other words, the survey participants hadn’t been properly conditioned by those conducting the research!! They overtly admit that they sought to influence the workshop members’ viewpoints prior to the polling.
Survey Question Results
The MassMoves report didn’t provide the actual survey in the report, at least not that I could find. I have to infer from statements provided in the report about the survey questionnaire design.
I would love to have seen the email invitation and introduction to see how they conditioned the respondent for the survey.
Condition of Transportation
System
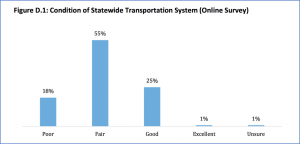
The opening question asks the condition of the “Massachusetts [sic] transportation system”. I do not know how they defined the term “transportation system” for respondents.
Call for Action
Yes, that’s what the unbiased researchers call the next question in the survey. I would love to see if that was the section heading in the survey questionnaire or the introduction.
The survey designers here used a 4-point Agreement scale. Agreement questions tend to get, well, agreement. That’s a known bias leading to a weakness in the research approach – or strength if you know the results you want to get.
The 4-point response-scale options add to the measurement distortion:
Strongly Agree – Somewhat Agree – Somewhat Disagree – Strongly Disagree
What if you “just” agree with the following statement? Well, you’re likely to go out to the Strongly Agree endpoint since you can’t just Agree. Here’s the Call to Action:
A much better transportation system for everybody should be an even higher priority for our elected officials than 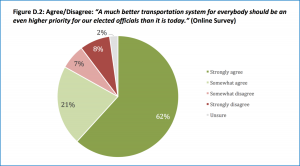 it is today.
Who would disagree with that statement? Certainly not this biased sample. In isolation, it’s a “motherhood and apple pie” question. 83% were on the Agree end of the scale, and the report writers point out that the percentages are lower than the even more biased sample in the workshops Think about what the sponsors of this research can do with the word “everybody” in that question.
21st Century Transportation Goal Priorities
The researchers switched to a 1-to-6 Importance scale to measure transportation priorities. Importance rating scales are a poor measurement tool. Why? They don’t ask the respondents to engage in trade-offs. The nature of a political process is a give-and-take among competing priorities.
This approach avoided such nasty reality. It allows everything to be important since the importance of each item is asked individually. And guess what? Everything was important.
Overall, all eleven potential actions were rated as importan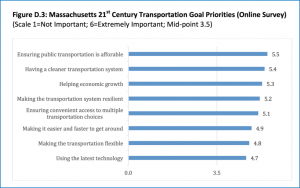 t by the online participants with means of 3.5 or higher.
What a surprise. (Why did they start the horizontal bars at zero?)
Curiously, “Making it easier and faster to get around” ranked 6th in importance. That “finding” should make you question the validity of the study. Isn’t that the reason we have transportation systems? How could that rank so low?
Statewide Public Transit System Strategy
Regarding Statewide Public Transit System Strategy, respondents were asked to rate the importance of Repair and Maintain (5.4), Enhance (4.9), and Expand (5.2) on the same 1-to-6 Importance scale. (Means in parentheses.)
As Figure D.5 sho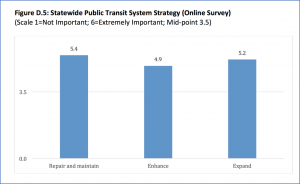 ws, there was strong support for all three strategies for the public transit system.
Of course there was! Respondents didn’t have to make hard choices of the relative importance that a different question format would have required. Ever heard of a fixed-sum question format or a single-response checklist question format?
Statewide Funding
Now let’s look at the Statewide Funding question. This is the question that made the press release to the media. You’ll see why.
The researchers went back to the Agreement scale, but this time using a 6-point scale, as opposed to the previous 4-point scale. (Huh? Why the change?) They asked level of agreement with these statements:
Everyone benefits from the transportation system, so everyone should pay their fair share for it, through broad general taxes (e.g., income tax)
People should pay for transportation based on how much they use the transportation system (e.g., tolls, transit fares)
Only 32% of respondents scored a 5 or 6 on the question advocating people pay for what they use. However, 73% of respondents scored a 5 or 6 on the question advocating “fair share” funding through income taxes. I say “income taxes” since that was the only example of a “broad general tax” the survey designers provided.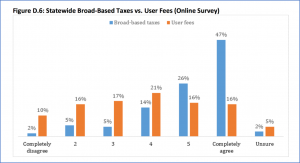
As a rule, professional surveyors do not include examples since they lead the respondent to think only about the example. Maybe that was the goal? Why wasn’t “sales tax” included in that example? We have a 6.25% sales tax, and it is a “broad general tax”.
Further, standard survey practice would be to alter the order of these two questions to negate any sequencing effects. They apparently did not do this.
I can’t help but get cynical that the questions were structured to generate the desired response. See why this question was the headline finding?
Issue Priorities
I think we get a good clue about the respondent group when we look at the results for Issue Priorities. For this question, inexplicably they moved to a 4-point Priority Scale.
(Why they constantly 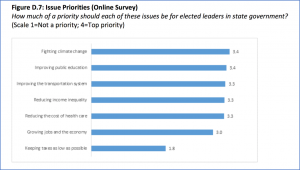 changed scale type and scale length is a true mystery. It’s certainly not general practice among professional surveyors. It increases respondent burden and makes comparison across questions impossible.)
Notice in the nearby chart that the one priority that falls way behind the others: “Keeping taxes as low as possible.” (1.8 on the 4-point scale.) Mind you, the citizens in 2013 passed by 53% to 47% a referendum to repeal indexing gas taxes to inflation and through referenda, the state income tax has been lowered.
So just how representative is the respondent group of the general population?
Survey Respondent Group
Now let’s look at the survey respondent group. Apparently, no demographic questions were asked, or if they were asked, they weren’t reported. So, we can only infer to what extent the demographic profile matches that of the Commonwealth.
“Approximately” 700 people were invited. These were people who self-selected to attend those evening “conversations.” 144 people responded for a 20% response rate. How many abandoned the survey part way through they don’t report.
That’s a pretty weak response rate from a group who allegedly were self-motivated. With approximately 4 million registered voters in the state, the statistical accuracy of this “survey” is roughly 95% +/-8%. That’s not great, especially given the extreme sample bias coupled with the non-response bias.
Would you want to base public policy on data from 144 people who are a biased sample of a biased participant selection process answering leading questions in a survey? Goodness, I hope not.
Was the point of this study to help guide strategic direction or generate data to support the policies of the group funding the research? You decide. Apply your critical thinking skills and read the report.
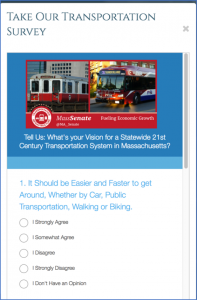
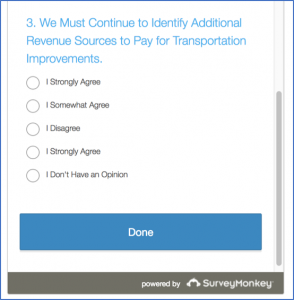
Addendum. Have a look at the 3-question survey about transportation you’ll find on the Mass Senate’s Commonwealth Conversation’s webpage. See if you can find the rather comical error in one of the questions shown here.
