How to Present the Survey Scale
In the surveying process, we typically use lots of scalar questions. You know, those 1-to-10 questions… We hope that they are interval rating scale questions, but that’s a separate discussion. At worst, they’re ordinal scale questions.
The survey designer must decide how to present the scale to the respondent – a critical survey design decision.
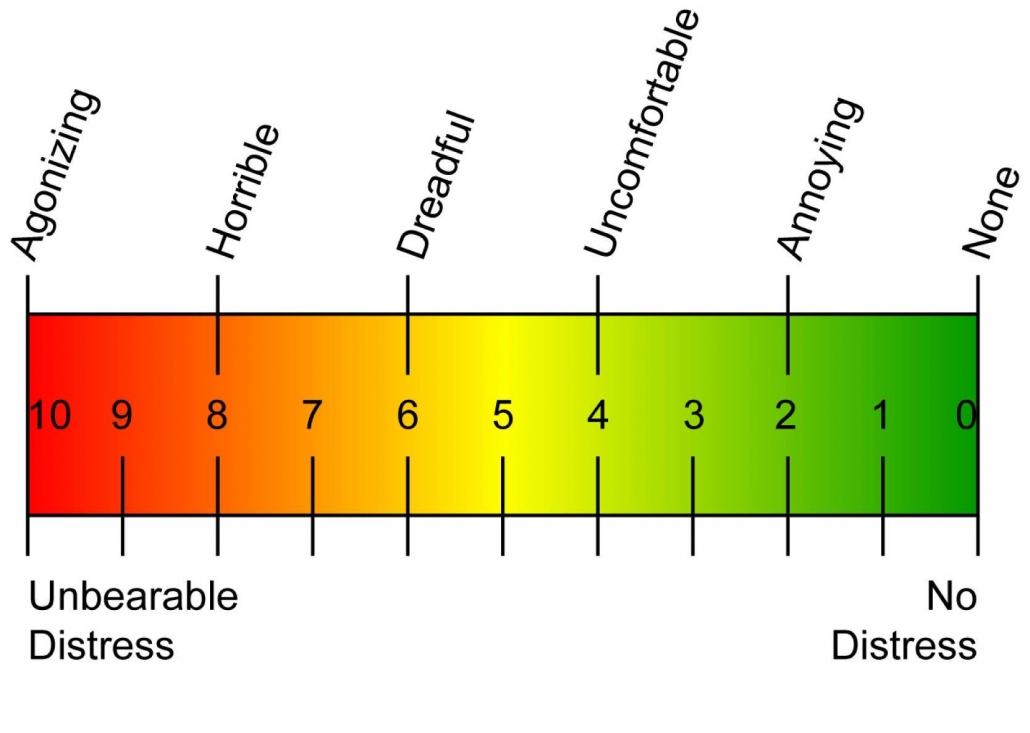
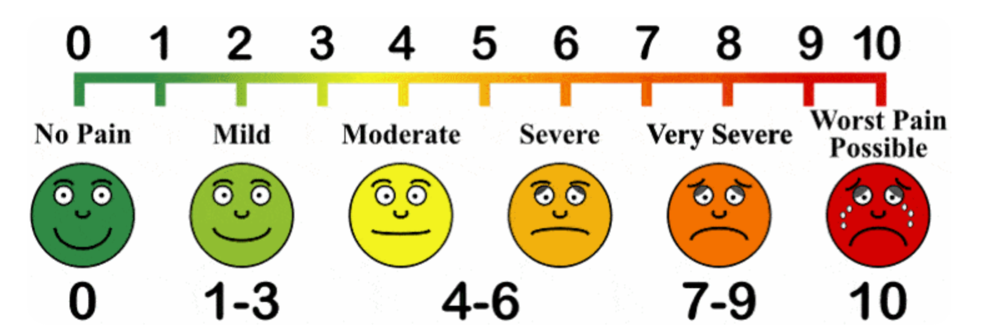
The surveyor has five different options for presenting the scale:
- Verbally: with words, whether spoken or written that describe some ascending order, such as Not Satisfied to Very Satisfied. (In the vernacular, “verbal” means “spoken” but properly it means use of words.)
- Numerically: with a numbered scale, such as a 1-to-5 or 1-to-10 scale.
- Ideographically: with pictures, such as icons or emojis that display increasing emotions.
- Visually: with a continuous line, marked with some low-to-high descriptors. (Personally, I prefer “Linear” as the term since ideographs are also “visual”.)
- Color Coding: using colors to imply scale direction and level. So called traffic-light color coding schemes are typically used. Red = bad. Yellow = neutral. Green = good. This color scheme appears to be cross-cultural, but it does have limitations for color blind respondents.
Regardless of the presentation method, the respondent is asked to identify the place on the scale that best matches their views. The choice is coded with a number to measure whatever we’re trying to understand – the phenomenon of interest – such as degree of satisfaction or level of pain. The response could be coded with the verbal descriptors, but text is a hassle to analyze.
All four of these presentation methods can be administered on paper or webform, but only the Verbal and Numerical methods can be presented orally — in a telephone or personal interview.


