Summary: Choice of the survey question types used in a questionnaire is a critical design decision. Survey question type determines the type of data generated, which in turn determines the type of analysis you can do with the survey data collected. No one best survey question type exist. The appropriate question type will be one that best generates valid, reliable data to answer your research question.
~ ~ ~
When your create a survey questionnaire, the critical questionnaire design issue is: how you are going to pose the survey questions to the respondent. Why critical? Because:
- The survey question type determines the data generated, and that limits the data analysis you can perform.
This article discusses that relationship. We also discuss when you should use each survey question type in your questionnaire. In other articles we discuss how to identify what survey questions you should be asking and critical issues in the phrasing of a survey question. Most importantly, we show how incorrect analysis of one data type could lead to incorrect conclusions.
The Five Survey Question Types
Once you’ve identified the issues you want to research, you now need to formulate them into survey questions, and you have many options in survey question types to consider.
- Open-ended textual questions
- Multiple choice questions
- Ordinal scale questions
- Interval scale questions
- Ratio scale questions
Each of these broad categories of survey questions types contains a number of different formats, but what differentiates among the survey question types is the type of data generated by the question.
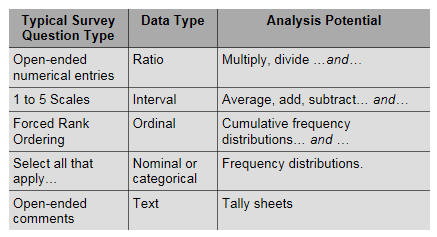
You might be thinking that “data are data.” (or datum is datum). But in fact, 5 data types exist, and the type of data generated by the survey question constrains the type of analysis you can perform. (Some may argue that text is not a type of data. Whatever…) See nearby table.

Notice that the analysis potential is cumulative. That is, as you move up the nearby table to a higher type of data, you can perform more mathematical operations. This is important! If you want to trend average scores on some survey question(s), then you have to choose question types that generate Interval or Ratio data. You cannot calculate means with ordinal and nominal data.
An Example of a Survey Data Analysis Error Cause By the Question Type
Here’s an example of an analysis error I personally witnessed. I was a member of a committee to select a new town administrator. After we had reviewed resumes and interviewed five finalists, the consultants running the process had each committee member rank order all five of the candidates — give a 5 to the candidate we liked best, a 4 to the next best person, and so on.
While we were doing this, the committee member next to me said, “Can I give two 5s? I thought candidates B and C were equally strong.” The consultants said no. (I also thought the same two candidates were neck and neck.)
The consultants then added the scores, presented the results, and wanted us to view the spread between the summed scores as indicative of the relative distance in how we assessed the candidates.
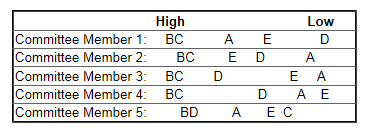
That last point is critical. Imagine if all of us on the committee had viewed the five candidates as shown on the following spatial map where the distance between candidate letters represents the difference we felt existed between them. Candidates to the left are more favored. Candidates to the right are less favored.

Applying the rank scores (that is, Committee Member 1 gave: B = 5, C = 4, A = 3, E = 2, D =1 and so on) and adding, the final scores would be:
Candidate A = 10
Candidate B = 25
Candidate C = 17
Candidate D = 13
Candidate E = 10
Survey Training Classes
Running your own survey programs? Learn how to do it right from us — the premier worldwide trainers for survey design & analysis.
Featured Classes:
The mathematical answer is clear. Candidate B is the winner with 25 points and the next nearest candidate, C, is a whopping 8 points behind, only 4 points ahead of Candidate D. But look at the spatial map. Is B that much superior? 4 of the 5 committee members thought B & C were really a dead heat. Member 5 didn’t like C for some reason — and liked D more than anyone else.
Are C & D closer in preference than B & C? That’s what the (bogus) math shows, yet the spatial map paints a different picture. B may be preferred to C, but it’s close enough to spark a reasoned debate. That debate in fact, is what happened in our deliberations.
What Wrong Data Analysis Did the Consultants Do?
The consultants had us rank order the candidates, generating ordinal data. They then treated the data as interval data and added the scores.
- Ordinal data means that the answers are in some order, but says nothing about the distance between the ordered items.
- Interval data means there’s an equal distance — cognitively — between the points on the scoring scale.
So, imagine instead that we had been asked to rate the candidates on a 1 to 10 scale. Done properly, that would have generated interval data — if we all viewed the difference a 10 and a 9 as the same as between a 9 and an 8, and so on.
In another article, I make the point that interval scales are not perfect. In fact, they are lousy for measuring importance among a set of factors — or in this case the preference for one candidate. If every member rated every candidate a 10, then no differentiation would result. That’s why the consultants wanted rank orders; it forced us to choose one over the other. But adding the rank scores was wrong mathematically. Near ties and huge gaps were treated the same in the math.
What Data Analysis Would Have Been Appropriate?
They could have developed cumulative frequency distributions that could be derived from the frequency distribution table below for the data displayed in the spatial map:

Look at this table. Candidates B is still the clear leading choice, but compare the analysis of the summed ranked scores with what this table shows. Are Candidates C & D closer than Candidates B & C as the ranked sums indicated? No. Candidate C clearly is second, but D is certainly more distant. This analysis, which is mathematically correct for ordinal data, does show B & C as being close contenders. But still missed is the fact that four of the five members felt those two candidates were almost the same.
Another alternative would have been to use a fixed sum (also known as fixed allocation) question format. In this case, we would have been told to allocate 100 points among the five candidates based upon our preferences. If we felt that all five were equal, then we would have given each 20 points. But if we felt one candidate was better we should allocate more than 20 points to that candidate. However, then some other candidate(s) would have to get lower scores. Our allocations must add to the fixed sum of 100 points.
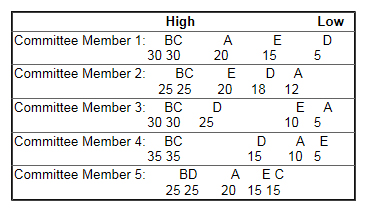
Based on the spatial map above, the scores might have something like:

These scores are shown in the table below with the averages for each candidate.

Notice what this analysis would show. Candidates B & C are neck and neck. (I used round numbers to simplify the display so maybe not quite so neck and neck.) Since the fixed sum question format captures relative distinctions and has interval properties, the data can be added and averaged. They better reflect the true underlying relationships.
Key Take-Away Regarding Survey Question Types
The point of this example is that you should think about the type of analysis you want to present to the decision makers and then chose question types that will properly support that kind of analysis. Performing illegitimate mathematical operations on a data set could lead to incorrect decisions!
There is far more to cover in the impact of question format upon data analysis — and other impacts on your survey program. Hopefully, this article open your eyes to the impact. Your choice of question types and question formats should not be haphazard or capricious. That decision will drive the analysis portion of your project — assuming you want to perform the analysis correctly. (duh…)
>> Read more about how to use the five survey question types.
Survey Consulting
We assist clients with their survey projects ranging from a self-help guidebook, to targeted assistance, to full service solutions.
Featured Services:
Customer Experience Management
We evaluate clients’ current feedback processes and drive improvements for customer recovery and bonding.
Featured Services:


